Tape Diagrams- A tool to make sense of problems
When I first read through the sample problems illustrating the different variation of addition and subtraction problems (Table 1 in the Appendix of the Mathematics CCSS), it struck me that the majority of these problems do not contain the "key" words that we teach students to look for when solving a word problem. I also noticed that several of the problems expressed the quantities in words instead of digits. Coincidence?... I don't think so.
Consider the following two examples from Table 1:
1) Julie has three more apples than Lucy. Lucy has two apples. How many apples does Julie have?
2) Julie has three more apples than Lucy. Julie has five apples. How many apples does Lucy have?
If a student attacked these problems using key words, they would think that they should perform the same operation to solve both problems. However, this is not the case. In the first problem, Lucy's two apples plus the three more that Julie has gives you Julie's number of apples. In the second problem subtracting the three more that Julie has from Julie's five apples gives you Lucy's number of apples. To solve the problem the students must actually be able to make sense of how these numbers are related.
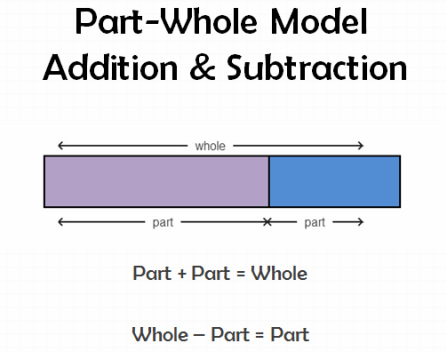
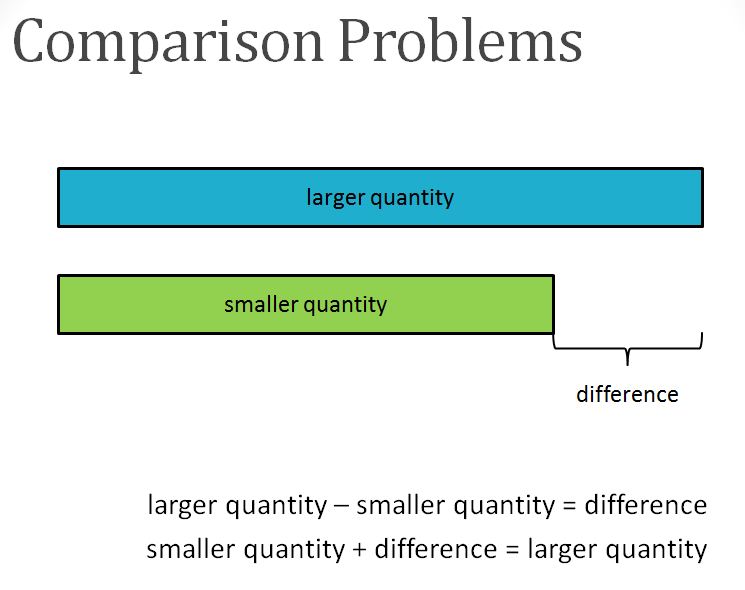
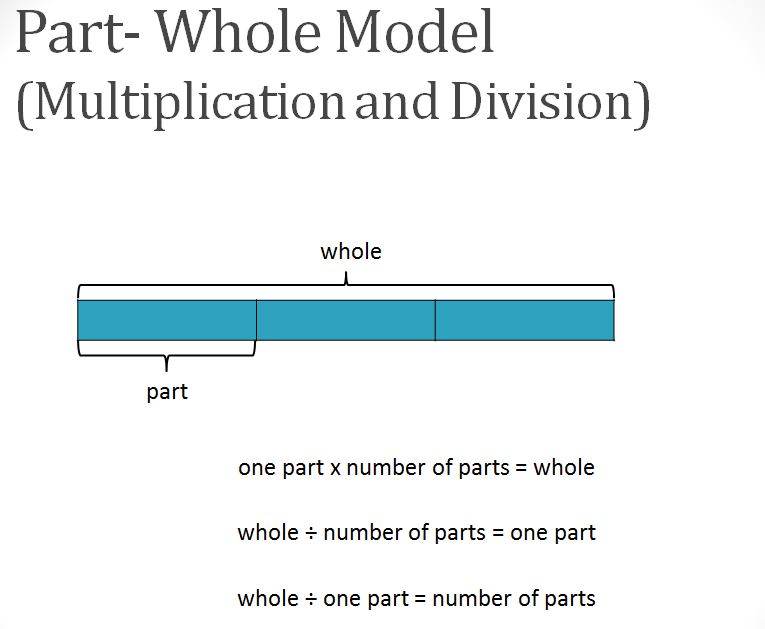
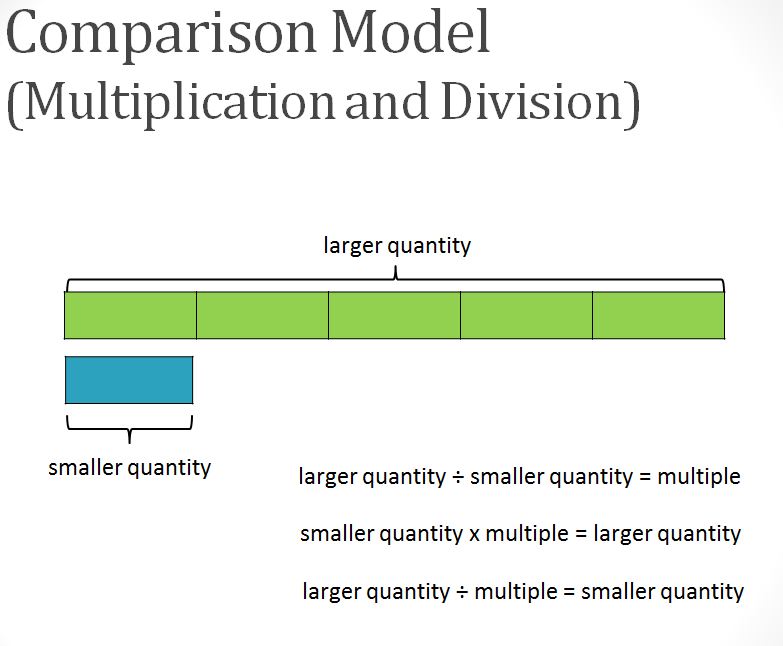
So how do we teach students to make sense of problems so they can persevere in solving them? Tape diagrams can be a great tool for representing these relationships (part/whole or comparison). In the attached document, you will see each of these problem types modeled with a tape diagram. The tape diagram is not an end in itself. It is a tool to help students see that while there are many different variations in wording, there are only two basic relationships in their addition and subtraction word problems (part/whole and comparison). If a student can picture these relationships, they will also have a great foundation from which we can build their understanding of multiplication and division word problems. The models will highlight the fact that multiplication and division involve equal parts. The tape diagrams also sets the stage for understanding the difference between additive comparison (3 more) and multiplicative comparison (3 times as many).
The file below shows each problem within Table 1 modeled with a tape diagram.
| table_1_tape_diagrams.docx |


 RSS Feed